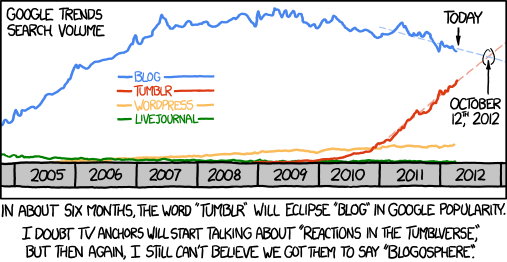
Back in 2012 XKCD #1043 presented data from Google Trends, predicting that searches for “tumblr” would overtake “blog” on 12th October 2012:
Fast-forward to present (2017) and we can see the prediction was a good, with “tumblr” overtaking “blog” sometime between October and November:
https://trends.google.co.uk/trends/explore?date=all&q=blog,tumblr,wordpress,livejournal
The data is available in CSV format and can be displayed easily using Pandas and Matplotlib. The XKCD extension for Matplotlib even gives it that XKCD-feel.
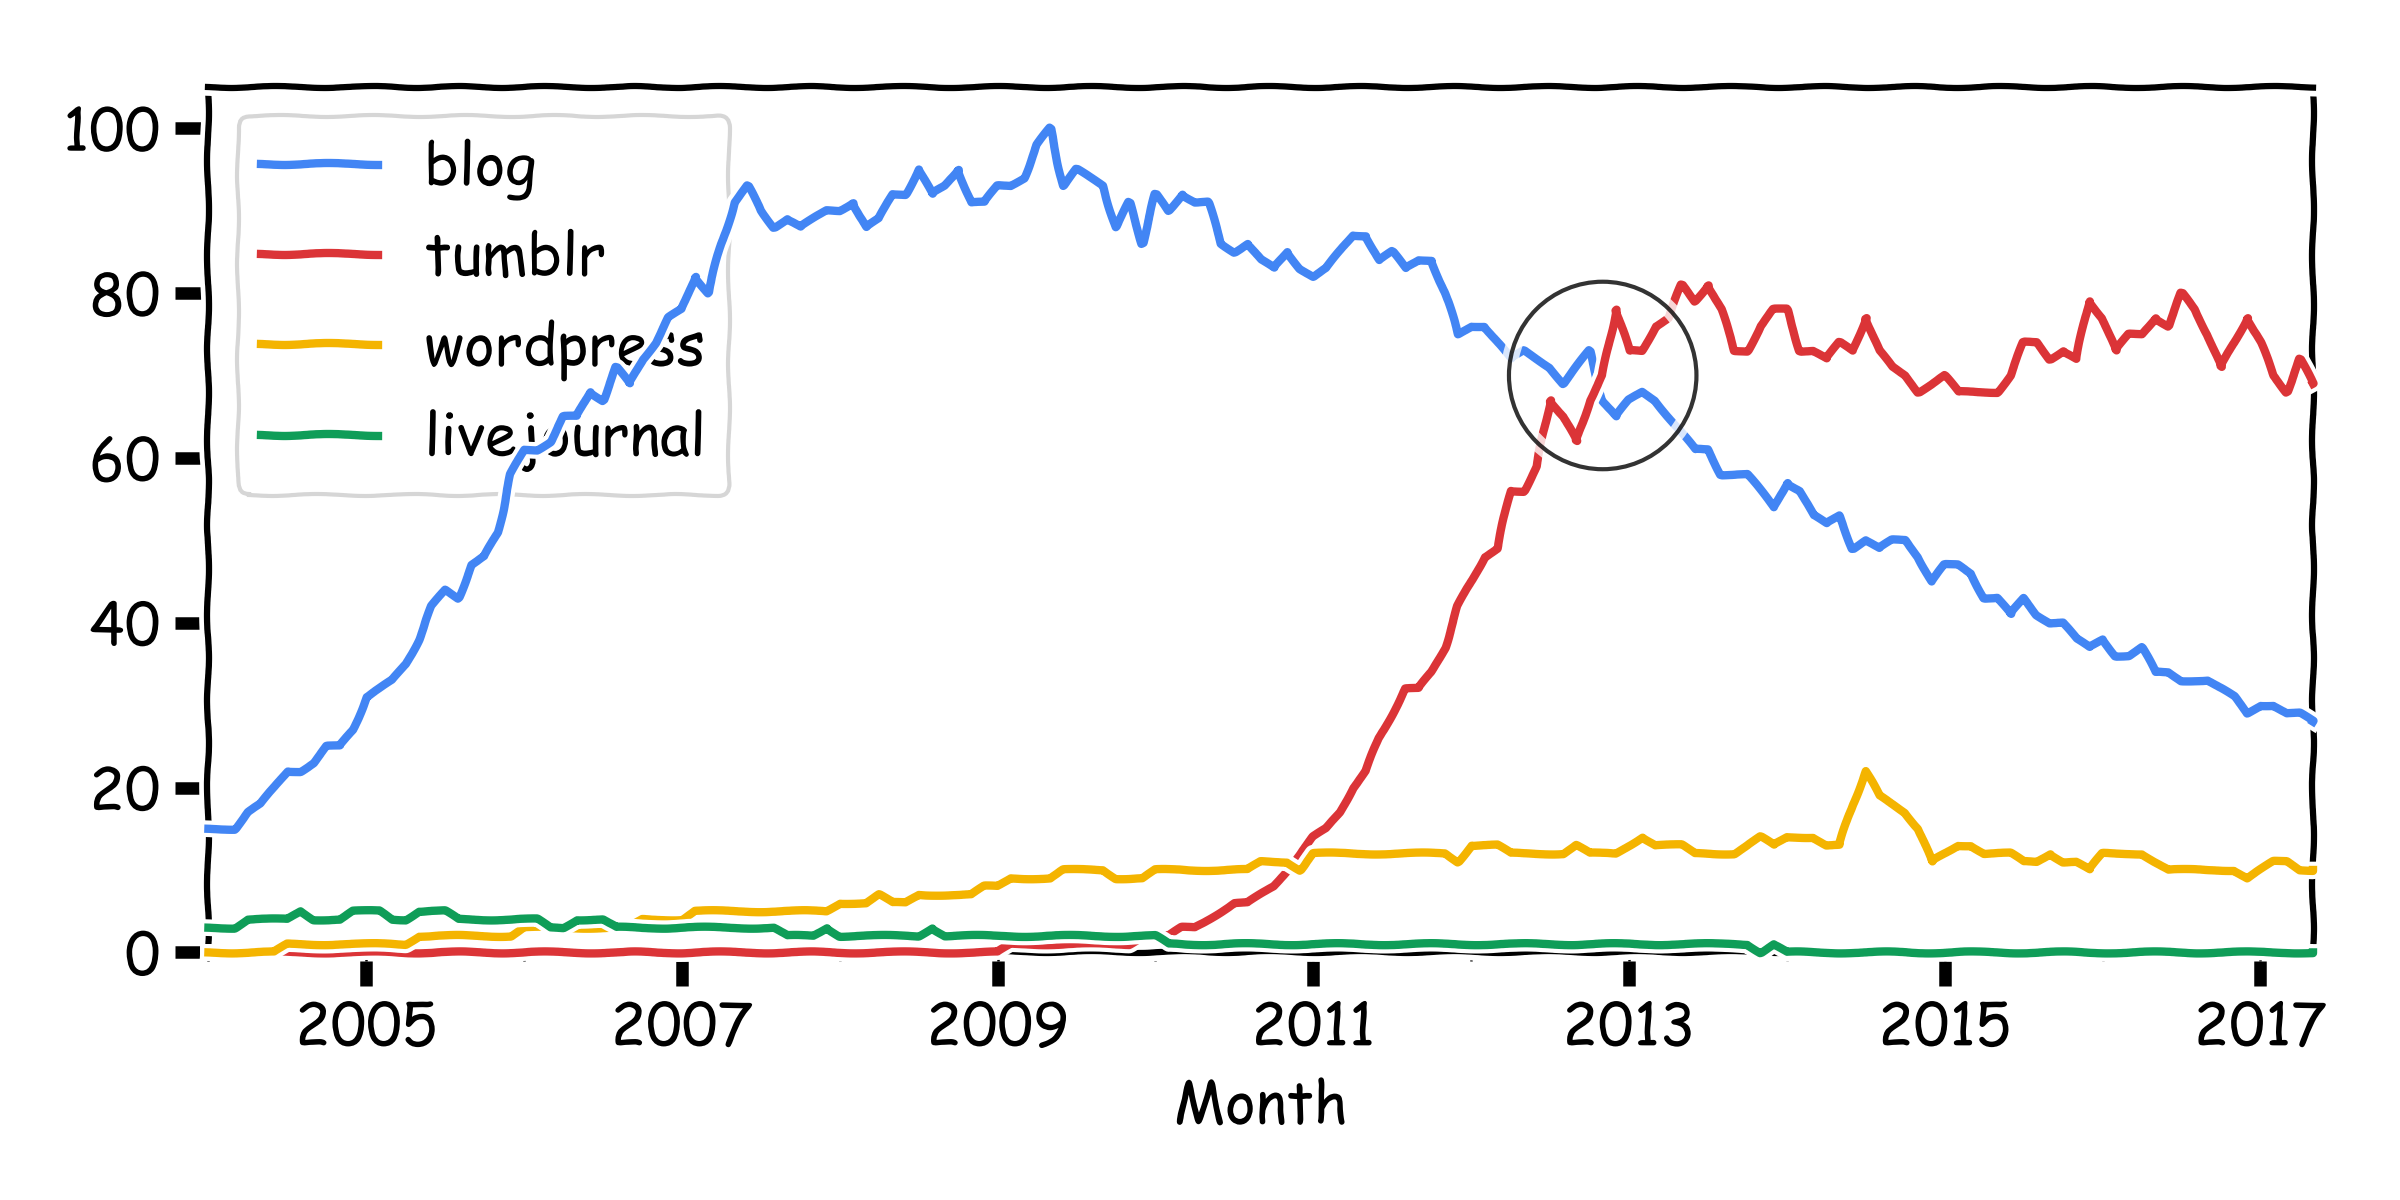
Interestingly, the “blog” trend has continued but “tumblr” has stabilized (for now).
import pandas
import matplotlib.pyplot as plt

plt.xkcd()

# prepare the data
df = pandas.read_csv("multiTimeline.csv", skiprows=1)
df.index = df["Month"].apply(lambda x: pandas.Period(x, freq="M"))
del(df["Month"])
df.columns = [x.split(":")[0] for x in df.columns]

# draw the plot
colors = ["#4285F4","#DB3437","#F4B400","#0F9D58"]
df.plot(figsize=(8, 4), color=colors, clip_on=False, zorder=100)
plt.plot(
    pandas.Period("2012-11"), 70,
    "o", zorder=200, markersize=45, alpha=0.8, markeredgecolor="k", color='none')
plt.ylim(0, None)
plt.legend(loc="upper left")
plt.tight_layout()
plt.savefig("xkcd_google_trends.png", dpi=300)