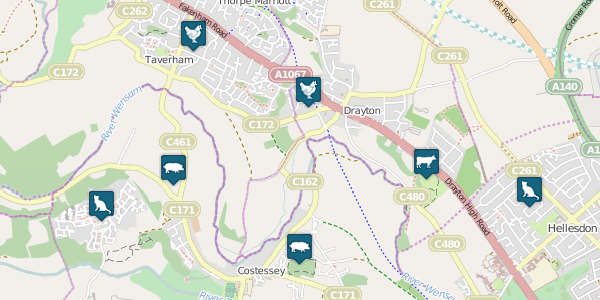
QGIS has support for using Scaleable Vector Graphics (SVGs) as marker icons. This gives you a lot of control over how markers appear on your maps. But what if the marker you want to use doesn’t have a vector version available? Fear not! Other image formats, including raster formats such as PNG and JPG, can be embedded in an SVG.
To do this is actually quite simple using the Inkscape vector graphics editor. Inkscape can be downloaded for free from the Inkscape website or via your operating systems package repository.
See below an example of using PNGs in a categorised layer.

Contains OpenStreetMap data © OpenStreetMap contributors. Marker icons are © Nicolas Mollet (CC BY SA 3.0).
Nathan Woodrow has a similar blog post using this technique for filling polygons with SVG textures which is worth a look too.
Creating SVG markers in Inkscape
Open a new document in Inkscape.
Import the PNG/JPG into the document by going to File > Import.... Select the PNG/JPG, then select the embed option.
Next, resize the document to fit the embedded image. Go to File > Document Properties..., then in the Resize page to content... section press the Resize page to drawing or selection button.
The focus of the marker (i.e. the point at which the marker touches the actual location of the point geometry) should be at the exact centre of the document. Adjust the document size accordingly. Time spent now getting this right will save time each time you use the marker as you wont have to calibrate the offset.
Save the document as an SVG by going to File > Save as....
Using SVG markers in QGIS
To use your new SVG as a marker symbol in QGIS, select SVG marker for the ‘Symbol layer type’ in the layer style dialog. Select the SVG file, and adjust the size and offset to suit.
QGIS will renderer markers in the order they are stored in the layer, which can look unnatural if a marker ‘above’ another marker overlaps it. To sort the layer so that features with a lower Y coordinate are drawn on top of those with a higher Y coordinate we can use the MMQGIS plugin, available from the official plugin repository.
Add a new field to your layer called ‘Y’ and set it to the value of the Y coordinate. This can be done using the field calculator and the following expression: $y.
Go to MMQGIS > Modify > Sort. Select your layer, the Y field, and a ‘Descending’ sort order so that features with a higher Y value will be drawn first. Specify a location for the output shapefile and press OK.
Apply the style to the new layer and the markers should render in a more natural looking way.