The Environment Agency recently released their database of River Habitat Surveys (RHS) as open data, available from the GeoStore under the Open Government Licence. RHS is described as the ‘standard for collecting data on the physical character and quality of river habitats across the UK’. The data comes in the from of an Open Office XML spreadsheet, and includes survey data collected in England, Wales, Scotland and Northern Ireland from 1994 - present.
The location of the survey points are given as grid references, either using the British National Grid (EPSG:27700) for sites in Great Britain, or the Irish Grid (EPSG:29903) for sites in Northern Ireland. To display the data in a GIS these grid references need to be converted into easting and northing coordinates. This post describes how this can be achieved using Python.
Both the British National Grid and Irish Grid systems uses a 5x5 grid labelled A-Z (skipping I) from top left (north west) to bottom right (south east). The Irish grid is the simpler of the two, using one grid of 100km squares. The British grid is more complex, with 500km squares further subdivided into 5x5 grids of 100km squares. In addition to this, the British grid uses a pair of false easting and northing values so that the bottom left corner of the SV tile is at 0,0 instead of 1000000,500000. The two grids are illustrated below, drawn using Cartopy and Natural Earth data.
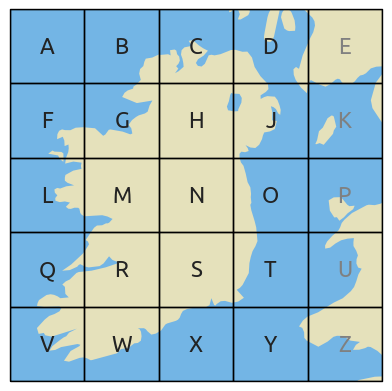
Grid references are given as a letter (Irish) or pair of letters (British) followed by numbers further subdividing the 100km square. The number of digits gives the precision, with a ‘10 figure’ grid reference accurate to 1 metre, an ‘8 figure’ to 10 metres and a ‘6 figure’ to 100 metres. For example, SP513061 identifies a 100 metre square at 451300,206100 in Oxford, England. Ordnance Survey provide more information on the British National Grid, including the excellent Guide To Coordinate Systems In Great Britain.
The Python functions given below convert both types of grid references into easting and northing coordinates (i.e. x,y coordinates), suitable for use in GIS. The same core function - grid2xy - is used for both grids, with helper functions to convert British and Irish grid references.
# 5x5 grid letters, missing I
alphabet = 'ABCDEFGHJKLMNOPQRSTUVWXYZ'

def grid2xy(false_easting, false_northing, gridsizes, grid_ref):
    '''Convert grid reference to coordinates'''
    # false easting and northing
    easting = -false_easting
    northing = -false_northing

    # convert letter(s) to easting and northing offset
    for n in range(0, len(gridsizes)):
        letter = grid_ref[n]
        idx = alphabet.index(letter)
        col = (idx % 5)
        row = 4 - ((idx) / 5)
        easting += (col * gridsizes[n])
        northing += (row * gridsizes[n])

    # numeric components of grid reference
    grid_ref = grid_ref[len(gridsizes):] # remove the letters
    e = '{:0<5}'.format(grid_ref[0:len(grid_ref)/2])
    e = '{}.{}'.format(e[0:5],e[5:])
    n = '{:0<5}'.format(grid_ref[len(grid_ref)/2:])
    n = '{}.{}'.format(n[0:5],n[5:])
    easting += float(e)
    northing += float(n)

    return easting, northing

def british2xy(grid_ref):
    false_easting = 1000000
    false_northing = 500000
    gridsizes = [500000, 100000]
    return grid2xy(false_easting, false_northing, gridsizes, grid_ref)

def irish2xy(grid_ref):
    false_easting = 0
    false_northing = 0
    gridsizes = [100000]
    return grid2xy(false_easting, false_northing, gridsizes, grid_ref)
The usage is simple, as demonstrated below.
grid_ref = 'SJ4950128500'
easting, northing = british2xy(grid_ref)

grid_ref = 'O1590434671'
easting, northing = irish2xy(grid_ref)
A further step is required in order to reproject the coordinates into the WGS84 geographic coordinate system (longitude and latitude) so that they can be stored in the same shapefile. This is done using the PROJ.4 library, via the pyproj module.
Reading the OOXML spreadsheet is achieved using the openpyxl module. The data could be output to a comma separated values (CSV) file or another spreadsheet, but instead we use fiona to write directly to an ESRI Shapefile. The script below only exports a minimal set of fields (the survey ID, site ID, grid reference, date and river name) to illustrate the process.
# PROJ.4 projection definitions
import pyproj
crs_british = pyproj.Proj(init='EPSG:27700')
crs_irish = pyproj.Proj(init='EPSG:29903')
crs_wgs84 = pyproj.Proj(init='EPSG:4326')
# prepare the output shapefile
import fiona
from collections import OrderedDict
crs = {'no_defs': True, 'ellps': 'WGS84', 'datum': 'WGS84', 'proj': 'longlat'}
properties = OrderedDict([
('surveyid', 'int'),
('siteid', 'int'),
('gridref', 'str'),
('date', 'str'),
('river', 'str'),
])
layer = fiona.open('rhs.shp', 'w', crs=crs, driver='ESRI Shapefile', schema={'geometry': 'Point', 'properties': properties})
# open the spreadsheet
from openpyxl import load_workbook
wb = load_workbook(filename='River_Habitat_Survey-Details_and_Scores.xlsx', use_iterators=True)
ws = wb.get_sheet_by_name('Sheet1')
rows_iter = ws.iter_rows()
header_row = rows_iter.next()
# iterate over the records
for row in rows_iter:
grid_ref = row[2].value
if grid_ref[1] in alphabet:
# grid reference is for the british national grid
easting, northing = british2xy(grid_ref)
lng, lat = pyproj.transform(crs_british, crs_wgs84, easting, northing)
else:
# grid reference is for the irish grid
easting, northing = irish2xy(grid_ref)
lng, lat = pyproj.transform(crs_irish, crs_wgs84, easting, northing)
# write output feature
properties = OrderedDict([
('surveyid', row[0].value),
('siteid', row[1].value),
('gridref', grid_ref),
('date', str(row[3].value)),
('river', row[4].value),
])
feature = {'geometry': {'type': 'Point', 'coordinates': (lng, lat)}, 'properties': properties}
layer.write(feature)
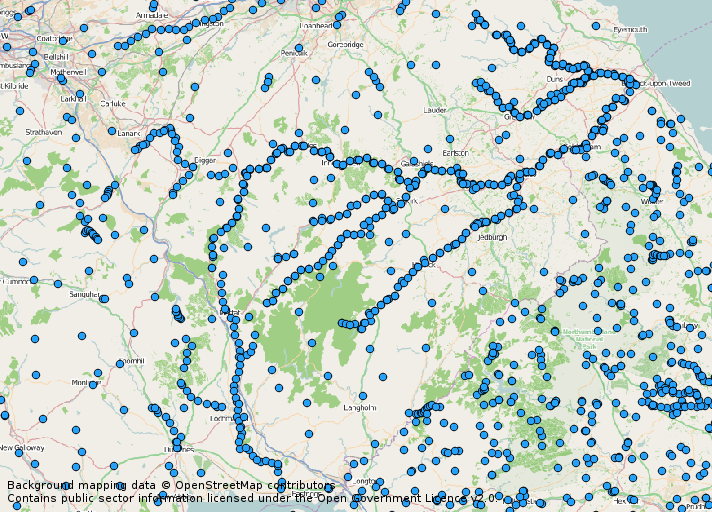
layer.close()The resulting shapefile can be checked against OpenStreetMap to verify that the projections have been handled correctly. As expected, the survey points follow the river lines. The map below clearly shows the survey points on the River Tweed and its tributaries.