This post demonstrates the basics of creating maps in Python using Cartopy with raster data read using Rasterio. Cartopy makes it easy to draw maps in matplotlib figures, using the Proj.4 library to handle any wacky projection you can throw at it, and the shapely Python module to work with vector data. Rasterio is a Python module for reading and writing raster data, built on the GDAL library.
Cartopy is often used with the basic image reading function imread() from matplotlib, which can read a selection of common image formats with support from the Python Image Library (PIL), or the Iris module for formats commonly used in meteorology and climatology. Using Rasterio enables you to read any of the long list of supported formats readable by GDAL used for geospatial data.
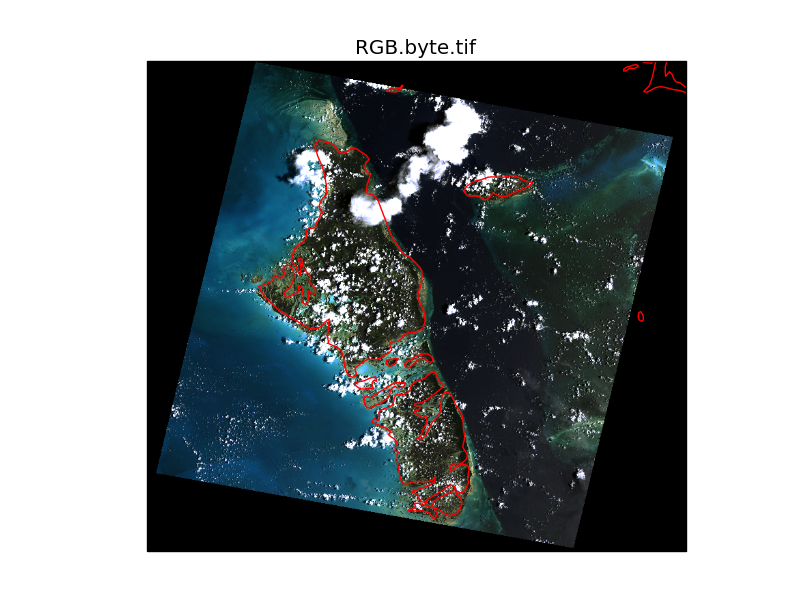
Jump to the end of the post to see the full code, and expected output. The RGB.byte.tif image used in the example below is from the rasterio test data, showing Andros Island, an archipelago in the Bahamas.
The first step is to open the image using rasterio.open, then read the data into a numpy array. The example image has 3 bands: red, green and blue. The src.read() method will read multiband data into a 3-dimensional array (i.e., band, row, col). Cartopy/matplotlib requires the color bands to be in the last dimension (i.e., row, col, band), so we use np.transpose(im, [1,2,0]) to reorder the dimensions.
To plot the image using Cartopy we need to know it’s extent. This is calculated using the 6 parameter affine transformation, src.transform, and the image height and width to give a bounding box: [xmin, xmax, ymin, ymax].
Next we need to define the layer’s projection as a Cartopy CRS object. In the example below this is easy, as we know (through inspection of the src.crs parameters) that the layer is projected in UTM zone 18N. For other layers you’ll have figure out which projection object to use and which parameters to pass - see the Cartopy projection list. Hopefully this will become simpler soon with better integration of Proj.4 in Cartopy (issue #153).
Next we create a new matplotlib figure. The only thing special here is the projection argument, which we pass the same CRS of the image. If a different CRS was specified, Cartopy would reproject the image into the canvas projection. I’ve not done that in this example because, at least on my (rather old) laptop, it takes some time to process the reprojection.
Finally we’re ready to plot the image using the matplotlib imshow() method. Rasterio (and GDAL) read images starting from the upper left pixel, so we need to pass the origin='upper' argument to get the image to draw the correct way up.
The coastline layer from the Natural Earth dataset can now be drawn on top. Cartopy handles the layer reprojection transparently so the coastlines appear in their correct locations.
The full script is shown below.
import numpy as np
import cartopy.crs as ccrs
import rasterio
import matplotlib.pyplot as plt

filename = 'rasterio/tests/data/RGB.byte.tif'
with rasterio.drivers():
    with rasterio.open(filename, 'r') as src:

        # read image into ndarray
        im = src.read()

        # transpose the array from (band, row, col) to (row, col, band)
        im = np.transpose(im, [1,2,0])

        # calculate extent of raster
        xmin = src.transform[0]
        xmax = src.transform[0] + src.transform[1]*src.width
        ymin = src.transform[3] + src.transform[5]*src.height
        ymax = src.transform[3]

        # define cartopy crs for the raster, based on rasterio metadata
        crs = ccrs.UTM(src.crs['zone'])

        # create figure
        ax = plt.axes(projection=crs)
        plt.title('RGB.byte.tif')
        ax.set_xmargin(0.05)
        ax.set_ymargin(0.10)

        # plot raster
        plt.imshow(im, origin='upper', extent=[xmin, xmax, ymin, ymax], transform=crs, interpolation='nearest')

        # plot coastlines
        ax.coastlines(resolution='10m', color='red', linewidth=1)

        plt.show()
The expected output of the script is shown below.